AI · Code · Strategy · 2026
Headless: why nobody is really steering
A hierarchy compresses a moving world into a few numbers for its leader, and the leader cannot know what it is missing. The surprise was what mattered most: not how much information reaches the top, but whether it stays true for as long as the decision it informs.
- Role
- Concept, simulation, code, writing
- Type
- Self-directed experiment
- Stack
- Single-file JavaScript · Canvas
- Method
- Identical-world sweeps, twin runs, predictions logged first
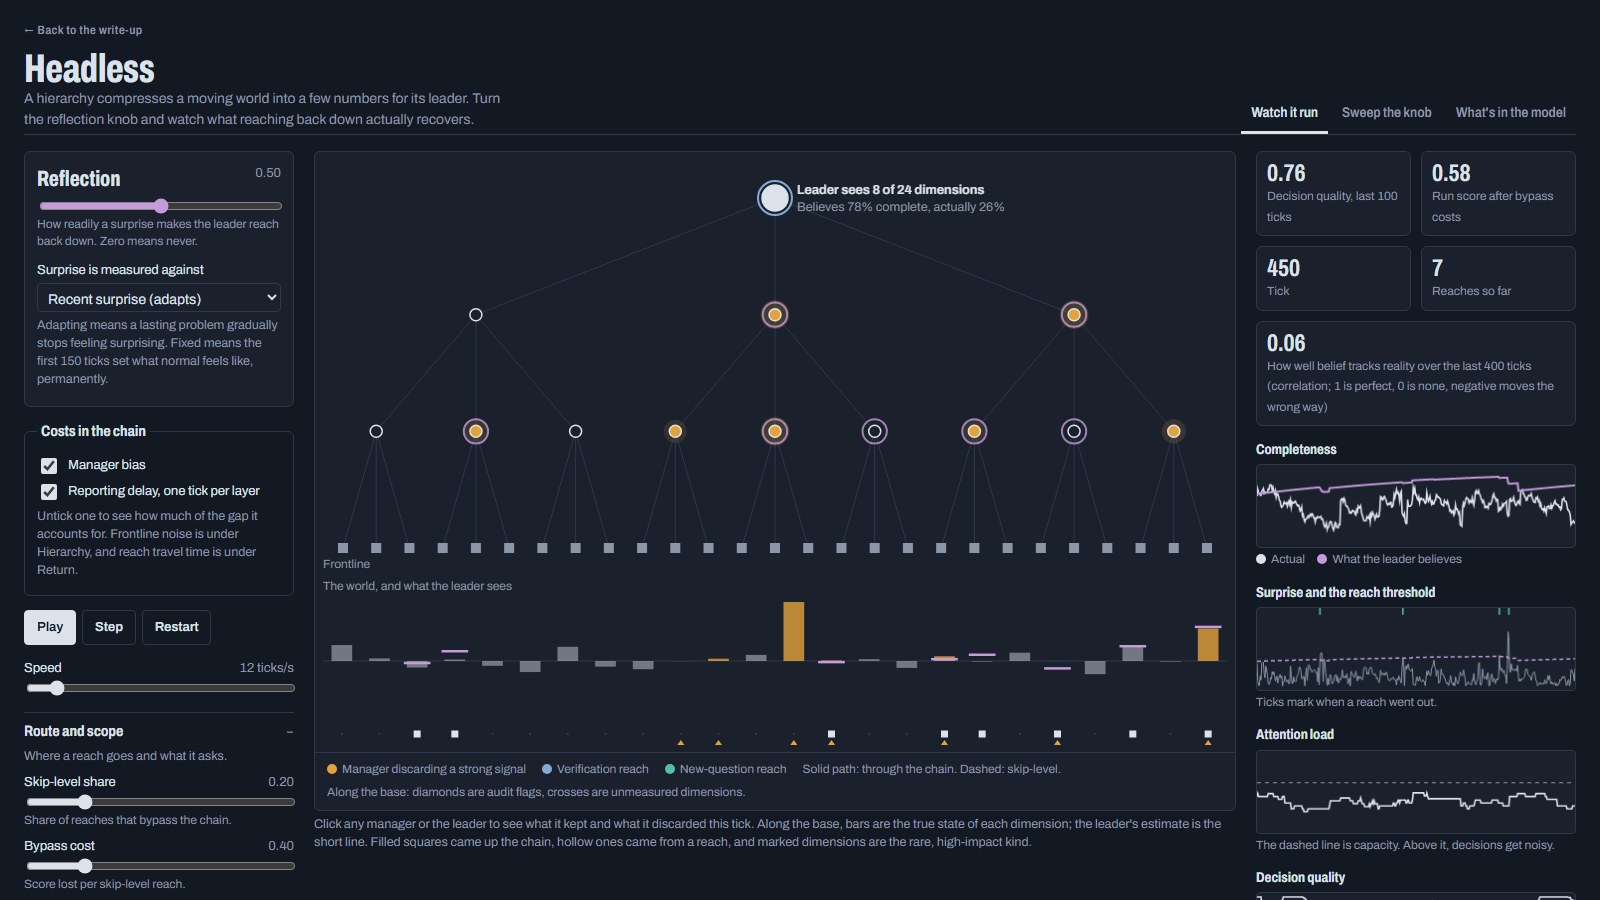
The study behind the simulator: the thesis it started from, every mechanism written out as a formula, every parameter the results could depend on, and the predictions that failed.
Abstract
In a simulated organization, the timing of decisions matters more than the volume of information behind them. Information only helps a decision if it stays true for as long as that decision is held, and a leader can only use as much as its attention allows.
This study began with a thesis: corporations where everyone is replaceable are "headless," moving as the aggregate of their units rather than by steering. Information climbs the hierarchy through lossy compression, and the top cannot know what it is missing. We turned each claim into a mechanism in an agent-based simulator, then tested it by sweeping parameters across thousands of simulated runs in identical worlds.
Several results support the thesis. Leaders' confidence in their own completeness does not track reality, and the organization performs acceptably regardless. Other results revised it. Discard is often harmless because data terminates where it is used. Reporting delay costs more than distortion. An AI audit that re-runs decisions with discarded data helps mainly by changing when strategy is reviewed, not by what it reveals.
Several of our predictions failed, and we report them alongside the ones that held. The model is not calibrated to real organizations, so its results are hypotheses about mechanisms, not measurements of firms.
How to read this document
This is the model's specification: what it assumes, how it works, and where its ideas come from. Sweep results and their interpretation live in a separate results log, so this document stays a stable reference while results accumulate.
Each result in the log records the model version it came from. The model has changed during development, and some changes shift averages slightly even when conclusions hold. This document describes the current version.
When we draw on prior research, we label how faithfully the model uses it:
| Label | Meaning |
|---|---|
| Implemented | The mechanism follows the source's formal idea closely. |
| Simplified | The source's idea is present, but in a reduced or stylized form. |
| Analogy | The source motivated the design, but the model does not implement its mathematics. |
We write for a general reader first. Formulas appear in the mathematics section, each followed by a plain statement of what it represents.
The thesis
The starting thesis made four claims about organizations in which every role can be replaced. Each was revised as we tried to make it falsifiable.
The original claims
- Headless movement. Where everyone can be replaced, no one can steer. No position sees the whole landscape, so the organization's movement is emergent: the aggregate of its units' actions.
- Path of least resistance. Given data, an organization always takes the path of least resistance toward its open-ended goal. That path is the result of a cost-benefit analysis on imperfect data, and the data degrades as the number of hops between collection and action rises.
- Lossy compression. Leadership forms a single direction by discarding data as it climbs the hierarchy. The layer below cannot be reconstructed from the layer above, and the layer above does not know what it is missing.
- Cheap discard of strong signals. Errors occur when something discarded as low-value was a strong signal. These errors go uncaptured, because you cannot know what you are not measuring.
How the claims were refined
Steering means reliable control. We defined steering as seeing what lies ahead and reliably moving the organization across it. By that definition almost nothing steers, so claim 1 needed a comparative form. Organizations with replaceable leadership should show less outcome control than those whose leaders are protected, and the gap should grow with hierarchy depth.
Least resistance is an axiom, not a claim. If every choice, including costly long-horizon bets, is by definition the output of a cost-benefit analysis, nothing can count against the claim. We therefore treat it as an organizing principle, as biology treats natural selection, and test the mechanisms built on it instead.
Discard is rational. We assume every layer discards sensibly at its own scale. The thesis becomes sharper: locally rational compression can still produce systemic blindness.
Terminal versus lossy discard. Much discarded data is not lost. It terminates at the level that uses it, as when a marketing department executes a campaign the CEO never sees. Discard is harmful only when data stops below a decision that needed it.
The timescale principle. A result from the simulator added a principle the thesis lacked. Information only has value if it stays true for as long as the decision it informs is held. A level that decides rarely can only use slow-moving signals, so fast-changing data sent to it is effectively terminal.
Foundational research
The model draws on organizational economics, cybernetics, organizational learning and decision theory. Most sources shaped a mechanism in simplified form; a few are analogies only. Each entry below was checked against a bibliographic or publisher record; entries still awaiting that check are listed at the end of the References.
| Source | What it established | How the model uses it | Fidelity |
|---|---|---|---|
| Williamson (1967) | Control loss: each subordinate satisfies only a fraction of a superior's intentions, and the loss compounds with hierarchy depth, limiting firm size. | Requests reaching down can be reinterpreted at each layer, with a fixed chance per hop. Reports lose fidelity layer by layer through discard, bias and delay. | Simplified |
| Downs (1967) | Officials act rationally and in their own interest; top officials must economize on information; control diminishes as organizations grow. | Every manager discards rationally and adds a consistent personal bias to what it passes up. | Simplified |
| Ashby (1956) | Law of requisite variety: a regulator can only control a system to the extent it commands as much variety as the disturbances it faces. | Motivates the definition of steering as reliable control and the leader's limited attention capacity. | Analogy |
| Marschak and Radner (1972) | Team theory: an organization is a problem of who knows what and who decides what, with information valued by the decisions it improves. | Frames the terminal-versus-lossy distinction and the delegated organization, where departments decide with their own data. | Analogy |
| Hayek (1945) | Knowledge of local circumstances is dispersed and cannot be fully transmitted to a central planner. | Departments hold fresher, less compressed data about their own domain than the leader can receive. | Simplified |
| Jensen and Meckling (1992) | Specific knowledge is costly to transfer, so decision rights should be placed with those who hold the relevant knowledge. | Delegation mode assigns implementation decisions to the departments that observe the relevant dimensions. | Simplified |
| Garicano (2000) | Knowledge-based hierarchies: frontline workers handle common problems, and rarer, harder problems pass to specialized solvers above. | Motivates why intermediate layers exist and why the top receives filtered rather than raw information. | Analogy |
| Geanakoplos and Milgrom (1991) | A theory of hierarchies built on limited managerial attention. | The leader has a fixed attention capacity; exceeding it makes decisions noisy. | Simplified |
| March (1991) | Adaptive processes refine exploitation faster than exploration, which is effective in the short run and self-destructive in the long run. | Verification (exploitation of known data) versus new questions (exploration of unseen dimensions). | Simplified |
| Levinthal (1997), building on Kauffman (1993) | Organizations adapt locally on rugged fitness landscapes; tightly coupled organizations fail more often in changing environments. | Motivates coupling between departments and the idea that no position sees the whole landscape. The model uses a drifting set of dimensions, not an NK landscape. | Analogy |
| Howard (1966) | Information value theory: information is worth what it improves in a decision, jointly considering probabilities and economic consequences. | The discard audit flags an unseen dimension only if adding it would improve the decision by more than a threshold. | Implemented |
| Friston (2010) | The free-energy principle: organisms act to minimize surprise, or prediction error. | Surprise, the gap between predicted and realized value, is the leader's only signal that something is missing. | Analogy |
| Bertrand and Schoar (2003) | Manager fixed effects explain a significant share of differences in firms' investment, financial and organizational practices. | A validation target for the "who matters" experiments, which vary one role's skill in otherwise identical worlds. | Validation target |
| Dechow and Sloan (1991) | CEOs reduce R&D spending in their final years, consistent with a shortened decision horizon. Later work with stronger controls found weaker support (Murphy and Zimmerman 1993, as reviewed here). | Motivates tenure as a horizon. Tenure currently resets memory and managers; it does not yet shorten planning horizons. | Not yet implemented |
| Slovic (2007) | Psychic numbing: concern for victims falls as numbers grow, so large-scale suffering fails to motivate action. | Motivates the thesis that empathy does not scale into organizational signals. Empathy is not modeled. | Motivation only |
| Grimm et al. (2005) | Pattern-oriented modeling: agent-based models should be tested against multiple patterns at different scales. | The standard for validating this model: each mechanism against its source result, then the whole against several real patterns. | Method |
Three further ideas shaped the design and are standard results, awaiting a citation check: the data processing inequality and rate-distortion theory from information theory, Simon's bounded rationality and satisficing, and Goodhart's and Campbell's observations that measures degrade once they become targets.
The model in plain terms
The simulator is a tree-shaped organization watching a moving world. Information climbs the tree, losing detail at every layer; decisions flow back down; and the leader can occasionally reach down to look for itself.
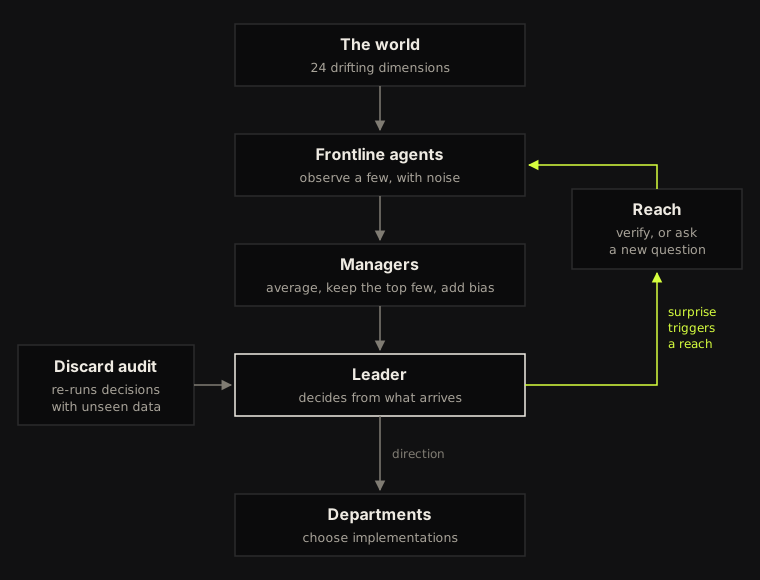
The diagram shows the full model; several parts are switched off by default.
The world
The environment has 24 dimensions that drift over time. Most are ordinary: they wander steadily and matter moderately. About a third are rare and high-impact: usually near zero, then occasionally hit by a large shock that fades over a few dozen ticks. Each option the organization can choose has a true value that depends on every dimension.
The hierarchy
Frontline agents each observe a few dimensions with noise. Each manager averages what its reports send, keeps only the dimensions it judges most important, and adds its own consistent bias. Its judgment of importance is the long-run average impact of each dimension, which is rational but systematically drops the rare, high-impact ones. Each layer adds a tick of delay.
The leader
The leader estimates each option's value from what arrived and picks the best. It holds two numbers: how much of what currently matters it can actually see, and how much it believes it can see. The gap is the blind spot. The leader cannot observe missing data directly; it can only feel surprise when outcomes miss predictions.
Reaching down
When surprise crosses a threshold, the leader reaches down. A reach can travel through the chain, where each layer may reinterpret the question and filter the answer, or skip levels at a cost. It can verify numbers the leader already has, or ask about dimensions it cannot see. Anything found stays in view for a while and consumes attention.
The discard audit
An optional audit represents an AI system with access to the organization's data. Each tick it adds back every unseen but measured dimension, re-runs the decision using the organization's model of the business, and flags any dimension that would improve the decision. The organization's model can be wrong, randomly or persistently, and can go stale as the world's structure shifts.
Delegation and direction
With delegation on, the leader only sets a direction and holds it until a review. Each department owns a slice of the dimensions and chooses one of four implementations using its own data. Reviews happen on a planning timer or when sustained surprise builds enough pressure. After a change, departments keep serving the old direction until they realign.
People
Managers and leaders can be replaced at an average tenure. Any role can also be made less skilled, meaning it misjudges its options, so its influence can be measured against an unweakened twin in the identical world.
The mathematics
Every mechanism is a short, explicit rule. Below, t is the tick, ε is a fresh standard normal draw, and each formula is followed by what it represents.
The world
Each dimension drifts back toward zero with random disturbance, a process known as Ornstein–Uhlenbeck. Rare dimensions are nearly still, but with a small chance each tick they receive a jump J of 3 to 6 units in either direction, which fades over a few dozen ticks. Rare dimensions carry importance 1.5; ordinary ones carry 1.
Each option's true value is a weighted sum of the world's dimensions. The weights M are fixed at the start and change only in a regime shift.
Discard and delay
Each manager averages its reports' values v, tracks a slow running average s of each dimension's importance-weighted size, and forwards only the K most important. It adds its own fixed bias b to everything it forwards. Because s is a long-run average, a rare dimension that is shocked right now still ranks low and is dropped.
Every node reads what its reports produced on the previous tick, so a leader at the top of a hierarchy with L layers sees the world as it was L ticks ago.
The leader's decision
The leader estimates each option's value from what it can see, treating unseen dimensions as zero, and picks the best. Load counts the dimensions held: one unit per dimension from the chain, one or two per dimension found by a reach, a quarter per active correction, and one for reading the audit. Above capacity C, noise proportional to the overload scrambles the choice; σV is the typical spread between options.
Decision quality is 1 for the best available option and 0 for the average of all options, which is what a random choice would earn. The run score is mean quality minus a bypass cost for each skip-level reach.
Surprise and belief
Surprise z is the miss on the chosen option, relative to recent misses. In the fixed-baseline mode, the reference is frozen after the first 150 ticks.
Belief in completeness falls only on large surprises and drifts back up during quiet periods. It is held between 0.02 and 1.
Actual completeness is the share of the world's current importance-weighted magnitude that the leader can see.
Reaching down
The reflection knob r lowers the threshold; r = 0 means never. Higher belief raises the threshold, so confidence suppresses looking. A reach through the chain takes 2Lh ticks, where h is the delay per hop; a skip-level reach takes 2h.
Through the chain, each question survives each layer with probability 1 − p, where p is the reinterpretation rate. Answers climb back through the same managers, each keeping about 70% of them, ranked by the same long-run importance. A verification compares reported numbers with an audited source; through the chain, the audit carries the same bias, so the correction is small. On arrival, verification raises belief by 15% of the remaining gap, and new questions move belief halfway toward actual completeness.
The discard audit
For each unseen but measured dimension, the audit adds its current value and asks how much better the best decision would be. It flags dimensions whose value of information exceeds τσV, up to a set number per tick, and watches them for 20 ticks. A quiet audit raises belief by 1% of the gap; each flag lowers it by 0.02.
The organization's model of the business starts equal to the true weights. Model error e adds a deviation Z that is either fixed (persistent) or redrawn every tick (random). A regime shift redraws the true weights for a quarter of the dimensions; the model never follows.
Delegation
Each direction's strategic value combines a slow-moving market term B with the state of the departments' domains, weighted by upward coupling c↑. Strategic stakes κ scales the whole term. The leader sees B with noise of 0.5 and the domain term only through the compressed chain.
Department k's implementation i earns value from its own domain, a spillover onto the next department's domain weighted by lateral coupling c→, and a fit with the current direction. The department sees its own domain directly but not the spillover, and it plans for the direction it believes is current.
Strategy pressure accumulates sustained surprise and audit flags, and decays over time. A review happens when P exceeds the pivot threshold or when the planning timer comes due. After a change, departments keep serving the old direction for the realignment time.
Skill and turnover
A less skilled role adds noise to its estimates: the skill gap g times the spread between its options, times ε. The leader is replaced every T ticks, forgetting its reaches and corrections. Each manager is replaced with probability 1/T per tick, receiving a new bias and a naive sense of importance.
Parameters and constants
The model has about 40 adjustable parameters and about 30 fixed constants. Every one is listed here, because a reader should be able to see every number that could shape a result.
Adjustable parameters
| Group | Parameter | Default | Meaning |
|---|---|---|---|
| World | Dimensions | 24 | Size of the world |
| World | Rare high-impact share | 0.30 | Share of dimensions that are rare and shock-prone |
| World | Shock rate | 0.006 per tick | Chance a rare dimension is hit |
| World | Regime shift rate | 0 | Chance per tick that a quarter of the dimensions change their effect |
| World | Unmeasured share | 0 | Dimensions no one observes |
| Hierarchy | Layers | 3 | Hops from frontline to leader |
| Hierarchy | Reports per manager | 3 | Branching of the tree |
| Hierarchy | Dimensions passed up | 6 | Channel width per manager |
| Hierarchy | Passed to the leader | same | Channel width of the top hop only |
| Hierarchy | Manager bias | 0.25 | Spread of each manager's fixed distortion |
| Hierarchy | Frontline noise | 0.25 | Observation error |
| Costs | Manager bias, reporting delay | on, on | Switches to remove either cost |
| Leader | Attention capacity | 16 | Units the leader can hold before overload |
| Leader | Surprise baseline | adapting | Adapting or fixed after 150 ticks |
| Reach | Reflection | 0.5 | How readily surprise triggers a reach |
| Reach | Skip-level share | 0.2 | Share of reaches that bypass the chain |
| Reach | Bypass cost | 0.4 | Score lost per skip-level reach |
| Reach | New-question share | 0.4 | Share of reaches that explore rather than verify |
| Reach | Questions per reach | 5 | Unseen dimensions asked about |
| Reach | Reinterpretation per hop | 0.15 | Chance a question is rewritten at each layer |
| Reach | Delay per hop | 2 ticks | Travel time of a request per layer |
| Reach | Watch duration | 60 ticks | How long a found dimension stays in view |
| Audit | Discard audit | off | Whether the audit runs |
| Audit | Flag threshold | 0.3 | Required improvement, in units of option spread |
| Audit | Most flags per tick | 3 | Cap on flags |
| Model | Model error | 0 | Deviation of the organization's model |
| Model | Kind of model error | persistent | Persistent or random each tick |
| Delegation | Delegate implementation | off | Two-level decisions |
| Delegation | Planning cycle | 100 ticks | Scheduled reviews |
| Delegation | Pivot pressure threshold | 6 | Pressure that forces a review |
| Delegation | Realignment time | 10 ticks | Delay before departments serve a new direction |
| Delegation | Upward coupling | 0.5 | Weight of departmental conditions in strategy |
| Delegation | Lateral coupling | 0.3 | Spillover onto the next department's domain |
| Delegation | Strategic stakes | 1 | Scale of strategic value versus local value |
| People | Average tenure | 500 ticks | Leader term and average manager tenure |
| People | Weaken | leader | Which role's skill is reduced |
| People | Skill gap | 0 | Decision noise relative to option spread |
| Run | Seed | 1 | Selects the world and organization |
Fixed constants
| Mechanism | Constant | Value |
|---|---|---|
| World | Ordinary drift: persistence, disturbance | 0.95, 0.30 |
| World | Rare drift: persistence, disturbance | 0.97, 0.05 |
| World | Shock size | 3 to 6 units |
| World | Importance: ordinary, rare | 1.0, 1.5 |
| World | Options the leader chooses among | 6 |
| World | Share of dimensions changed by a regime shift | 25% |
| Hierarchy | Dimensions each frontline agent observes | 4 |
| Hierarchy | Importance learning rate | 0.01 per tick |
| Hierarchy | Starting importance: ordinary, rare | 0.75, 0.12 (times weight) |
| Hierarchy | Starting importance of a new manager | 0.5 |
| Hierarchy | History kept for delayed values | 64 ticks |
| Leader | Overload noise scale | 1.5 option spreads |
| Leader | Surprise baseline learning rate | 0.02 per tick |
| Leader | Surprise level that causes doubt; doubt rate | 2.5; 0.02 |
| Leader | Confidence recovery rate | 0.004 per tick |
| Leader | Starting belief, and after replacement | 0.9 |
| Reach | Trigger threshold | 0.6 + 3.4(1 − r), times (0.5 + belief) |
| Reach | Share of answers kept per layer | 70% |
| Reach | Attention cost: chain, skip-level, correction | 1, 2, 0.25 |
| Reach | Belief change: verification, new question | +15% of gap; halfway to actual |
| Audit | Attention cost of reading the audit | 1 |
| Audit | Watch duration of a flag | 20 ticks |
| Audit | Belief change: quiet, per flag | +1% of gap; −0.02 |
| Delegation | Implementations per department | 4 |
| Delegation | Market drift: persistence, disturbance | 0.98, 0.30 |
| Delegation | Leader's market view noise | 0.5 |
| Delegation | Scale of fit with a direction | 1.5 |
| Delegation | Pressure decay; surprise offset | 0.95; 1.5 |
| Measurement | Burn-in before measuring | 150 ticks |
| Measurement | Strong signal (for discard counts) | importance-weighted size above 2.2 |
| Measurement | Large surprise; large miss | above 1 and 1.5 option spreads |
| Measurement | Window for worst stretch | 50 ticks |
Assumptions
Every result depends on the choices below. Some are deliberate simplifications; others are placeholders for mechanisms not yet built.
About the world
- Value is linear. Each option's value is a weighted sum of the dimensions, with no interactions between them. Real strategic problems often have interacting factors, as in rugged-landscape models.
- The world is stationary between regime shifts. Dimensions drift around fixed averages; there are no long-run trends.
- Rare events are rare in a fixed way. Shock size and frequency are constant, and shocks are independent across dimensions.
About people
- Everyone discards rationally. Managers rank dimensions by long-run importance, with no politics, self-protection or deliberate concealment. Bias is a fixed offset, not strategic spin.
- Belief has one job. In the original mode, the leader's belief in its own completeness affects only when it reaches down. It does not change how boldly it decides or commits.
- Skill is noise. A less skilled person misjudges options randomly, not in a consistent direction.
- No incentives. People do not optimize for their own careers, bonuses or tenure. Horizon effects from tenure are not yet modeled.
About knowledge
- The leader knows the structure of the business. In the original mode, the leader knows exactly how each dimension affects each option's value; its only problem is data. Model error, when switched on, relaxes this for the leader and the audit.
- Departments know their own business perfectly. In delegation mode, model error affects only the leader's strategic view.
- Unseen means zero. The leader treats an unseen dimension as sitting at its average, rather than reasoning about what it might be.
- New questions are random. The leader cannot target its exploration, because it does not know what it is missing. Only the audit targets.
About structure
- The hierarchy is a regular tree. Every manager has the same number of reports, and information flows only up the tree, never sideways between departments.
- Replacement is memoryless. A replaced manager's successor starts with no sense of what matters. There is no handover.
- Attention is a single budget. All information costs the same attention per unit, apart from the fixed discounts and premiums listed in the constants.
About measurement
- Quality is relative. A score of 1 means the best available choice, not an absolute level of performance, and scores are comparable only within a mode.
- Parameters are illustrative. No value is calibrated to a real organization. Results are statements about mechanisms under these settings, and robust findings should hold across several settings.
Method
Every comparison is made in identical simulated worlds, so differences between results come from the organization, not from luck.
Identical worlds
The simulator draws random numbers from separate streams: one for the world, and others for frontline noise, turnover, skill, the model of the business, regime shifts and reaches. Two runs with the same seed therefore face exactly the same world, even when their organizations behave differently. This technique is known in simulation as common random numbers. It makes paired comparisons far more precise than the error bars on independent runs suggest.
Sweeps
A sweep varies one setting across a range, compares two to four versions of the organization as separate lines, and holds every other setting fixed at the values in the live view. Each point averages several runs in different worlds, and error bars show one standard error. Runs start with a 150-tick burn-in that is not measured.
Twin runs
When a role is weakened, each run is paired with an unweakened twin in the identical world. The score lost and the share of time the two head in different directions measure that person's influence. Direction divergence is sensitive: a negligible skill gap in one department head can send the paths apart about 18% of the time through surprise and pressure. It measures how much the path depends on a person; score lost measures whether it matters.
Metrics
| Metric | What it measures |
|---|---|
| Score | Mean decision quality minus bypass costs |
| Decision quality | Chosen option relative to the average and the best |
| Actual completeness | Share of what currently matters that the leader can see |
| Blind spot | Believed minus actual completeness |
| Belief tracking | Correlation over time between believed and actual completeness |
| Reaches | Reaches per 1,000 ticks |
| Strong signals discarded | Discards of currently strong signals per 1,000 ticks |
| Surprise frequency | Share of ticks with a miss larger than the usual option spread |
| Worst surprises | Size of the worst 1% of misses |
| Large misses | Choices at least 1.5 spreads below the best, per 1,000 ticks |
| Worst stretch | Lowest 50-tick average of decision quality |
| Blind spot before worst surprises | Extra blind spot in the 10 ticks before the worst 1% of misses |
| Direction changes | Pivots per 1,000 ticks, in delegation mode |
| Time misaligned | Share of ticks a department serves an old direction |
| Score lost, direction divergence | Twin-run measures of one role's influence |
Predictions first
Predictions are written down before each experiment and recorded in the results log with the outcome, including those that fail. When a result surprises us, we test the proposed explanation with a further experiment before accepting it.
Validation
Following pattern-oriented modeling, each mechanism should reproduce its source result on its own before being trusted in combination. The combined model should then match several independent real-world patterns without retuning. That validation has not yet been done; see Limitations.
Reproducibility
Each result in the log records the model version, every setting, the number of runs and ticks, and the seed range. The simulator is a single self-contained web page, so anyone can rerun any result.
Findings to date
Eleven findings so far: seven hold, three came from predictions that failed and were revised, and one is open. Full settings, plots and inferences for each will appear in the results log. Numbers below come from sweeps of 20 to 40 runs, mostly at default settings.
| Finding | Status | Evidence |
|---|---|---|
| The leader's belief in its own completeness does not track reality, yet decisions stay acceptable. | Holds | Belief sits near 80% whatever the reflection level. Belief only sets when the leader looks, and routine compression delivers most of what matters. |
| The negative link between belief and reality is the signature of a working feedback loop. | Revised | Surprise lowers belief and triggers a reach; the reach raises actual completeness while belief is still low. Around reaches, actual rises from 0.53 to 0.59 as belief falls from 0.80 to 0.75. Two earlier explanations, habituation and verification, failed tests. |
| Reflection pays only when the leader has attention to spare. | Holds | The best reflection level is 0 at capacity 8, about 0.4 to 0.6 at capacity 16, and 1.0 or higher at capacity 32. |
| Verification builds confidence without adding visibility. | Holds | Verification-only reaching leaves actual completeness at 0.50 while the blind spot widens. |
| The managers who create the blind spot also protect against overload. | Holds | Reaches through the chain tolerate reflection up to about 0.8. Skip-level reaches lower the score at any reflection level at capacity 16. |
| Reporting delay costs more than manager bias. | Holds, parameter-dependent | At capacity 32, removing delay adds 0.055 to 0.08; removing bias adds 0.01 to 0.02; removing frontline noise adds 0.003. The ratio depends on the bias setting. |
| An AI audit trades frequent small misses for rare large ones only above a crossover in model error. | Revised | The audit cuts surprise frequency and, at low model error, also shrinks the worst surprises. Above model error of about 0.6 to 0.8 (persistent) or 0.8 to 1.0 (random), its worst surprises exceed no-audit's, yet large misses stay fewer. |
| An audit harms a leader with no attention to spare. | Holds | At default settings, the audit lowers the score from 0.59 to 0.27 at capacity 8 and raises it from 0.68 to 0.75 at 16 and from 0.67 to 0.78 at 32. |
| Information only helps a decision if it outlasts that decision. | Revised | Cutting what reaches the leader barely matters at the default 100-tick planning cycle, even when departmental conditions drive strategy. With reviews every 5 ticks, the leader's data raises the score from 0.65 to 0.73. |
| An audit that triggers strategy reviews beats every other revision rule. | Holds, with a caution | Pressure plus audit scores 0.69, against 0.63 for pressure alone and 0.67 for a 20-tick timer. Its benefit comes entirely from timing; flags that add no pressure score 0.62. Pivots are cheap at the default realignment time, which may drive this result. |
| A department head can matter more than the leader. | Open | The test is built but not yet run. A negligible skill gap in one department head already changes the organization's direction about 18% of the time, through surprise and pressure. |
Three predictions failed outright: that habituation causes the blind spot, that the audit causes strategic whiplash at high model error, and that coupled organizations would fall furthest behind uncoupled ones at short planning cycles. The last was backwards: they fall furthest behind at long cycles.
A change to the simulator's random streams, made for the twin runs, shifted some averages slightly, for example from 0.677 to 0.676 at defaults. No conclusion changed.
Limitations and open questions
The model's results are hypotheses about mechanisms, not measurements of real organizations. The main limits follow.
What the model cannot yet tell you
- Nothing is calibrated. No parameter is fitted to data from real firms, so magnitudes such as "a 0.08 gain" mean nothing outside the model. Directions of effect and crossovers are the meaningful outputs.
- Mechanisms are not yet validated one by one. Pattern-oriented modeling asks each mechanism to reproduce its source result before being combined, for example Williamson's control loss curve or March's exploration decay. That has not been done.
- Managers only relay. Real managers also solve problems, handle exceptions and carry context that has no measurement. The model scores the loss of that context as zero.
- No incentives or politics. Discard is honest and bias is fixed. Strategic concealment, career concerns and tenure-shortened horizons are absent.
- Belief has little causal reach. A leader's confidence affects only when it looks, not how it commits, so the model cannot yet say whether miscalibration matters for strategy.
- Pivots may be too cheap. Realignment is a short delay with no permanent cost, which may favor frequent strategy changes.
- Sensitive paths. Small differences can send an organization onto a different direction path. Results about paths need the calibration described in the Method section.
Open questions
- Does a department head matter more than the leader at default stakes, and at what strategic stakes does the leader matter more?
- At what realignment time does pivoting whenever the data says so stop paying?
- Does the audit's tail crossover appear when model error comes from stale structure, through regime shifts, rather than static error?
- Does miscalibrated belief start to cost performance once confidence also raises the pivot threshold?
- Can the model reproduce the real-world patterns in the CEO-effect and executive-horizon literature without retuning?
References
Each reference below was checked against a bibliographic or publisher record. Links go to the record used.
- Ashby, W. R. (1956). An Introduction to Cybernetics. London: Chapman and Hall. Record
- Bertrand, M., and Schoar, A. (2003). Managing with style: The effect of managers on firm policies. Quarterly Journal of Economics, 118(4), 1169–1208. Paper
- Dechow, P. M., and Sloan, R. G. (1991). Executive incentives and the horizon problem: An empirical investigation. Journal of Accounting and Economics, 14(1), 51–89. Record
- Downs, A. (1967). Inside Bureaucracy. Boston: Little, Brown. A RAND Corporation research study. Record
- Friston, K. (2010). The free-energy principle: A unified brain theory? Nature Reviews Neuroscience, 11(2), 127–138. Paper
- Garicano, L. (2000). Hierarchies and the organization of knowledge in production. Journal of Political Economy, 108(5), 874–904. Record
- Geanakoplos, J., and Milgrom, P. (1991). A theory of hierarchies based on limited managerial attention. Journal of the Japanese and International Economies, 5(3), 205–225. Record
- Grimm, V., Revilla, E., Berger, U., Jeltsch, F., Mooij, W. M., Railsback, S. F., Thulke, H.-H., Weiner, J., Wiegand, T., and DeAngelis, D. L. (2005). Pattern-oriented modeling of agent-based complex systems: Lessons from ecology. Science, 310(5750), 987–991. Record
- Hayek, F. A. (1945). The use of knowledge in society. American Economic Review, 35(4), 519–530. Record
- Howard, R. A. (1966). Information value theory. IEEE Transactions on Systems Science and Cybernetics. Record
- Jensen, M. C., and Meckling, W. H. (1992). Specific and general knowledge, and organizational structure. In L. Werin and H. Wijkander (Eds.), Contract Economics (pp. 251–274). Oxford: Blackwell. Paper
- Kauffman, S. A. (1993). The Origins of Order. Oxford University Press. Cited in
- Levinthal, D. A. (1997). Adaptation on rugged landscapes. Management Science, 43(7), 934–950. Record
- March, J. G. (1991). Exploration and exploitation in organizational learning. Organization Science, 2(1), 71–87. Paper
- Marschak, J., and Radner, R. (1972). Economic Theory of Teams. Cowles Foundation Monograph 22. New Haven: Yale University Press. Record
- Murphy, K. J., and Zimmerman, J. L. (1993). Financial performance surrounding CEO turnover. Journal of Accounting and Economics, 16(1–3), 273–315. Cited in
- Slovic, P. (2007). "If I look at the mass I will never act": Psychic numbing and genocide. Judgment and Decision Making, 2(2), 79–95. Record
- Williamson, O. E. (1967). Hierarchical control and optimum firm size. Journal of Political Economy, 75(2), 123–138. Described in
Awaiting verification
These standard results shaped the design but have not yet been checked against a source record:
- Shannon's information theory, the data processing inequality and rate-distortion theory, likely cited through a standard textbook
- Simon on bounded rationality and satisficing
- Goodhart and Campbell on measures that degrade once they become targets
- Uhlenbeck and Ornstein on the mean-reverting process used for the world's drift
Companion pieces. Time Given, Time Taken runs the same method on the market outside the firm. Gradient Walker models a whole organization growing, eating its ground and losing sight of itself. Headless zooms in on one part of that: how information travels up a hierarchy, how long it stays true, and why no one ends up steering.